Work under NDA. Some details and visuals have been adjusted. The design thinking and process are all here.
Leonteq AG · 2022
Crypto Structured Products
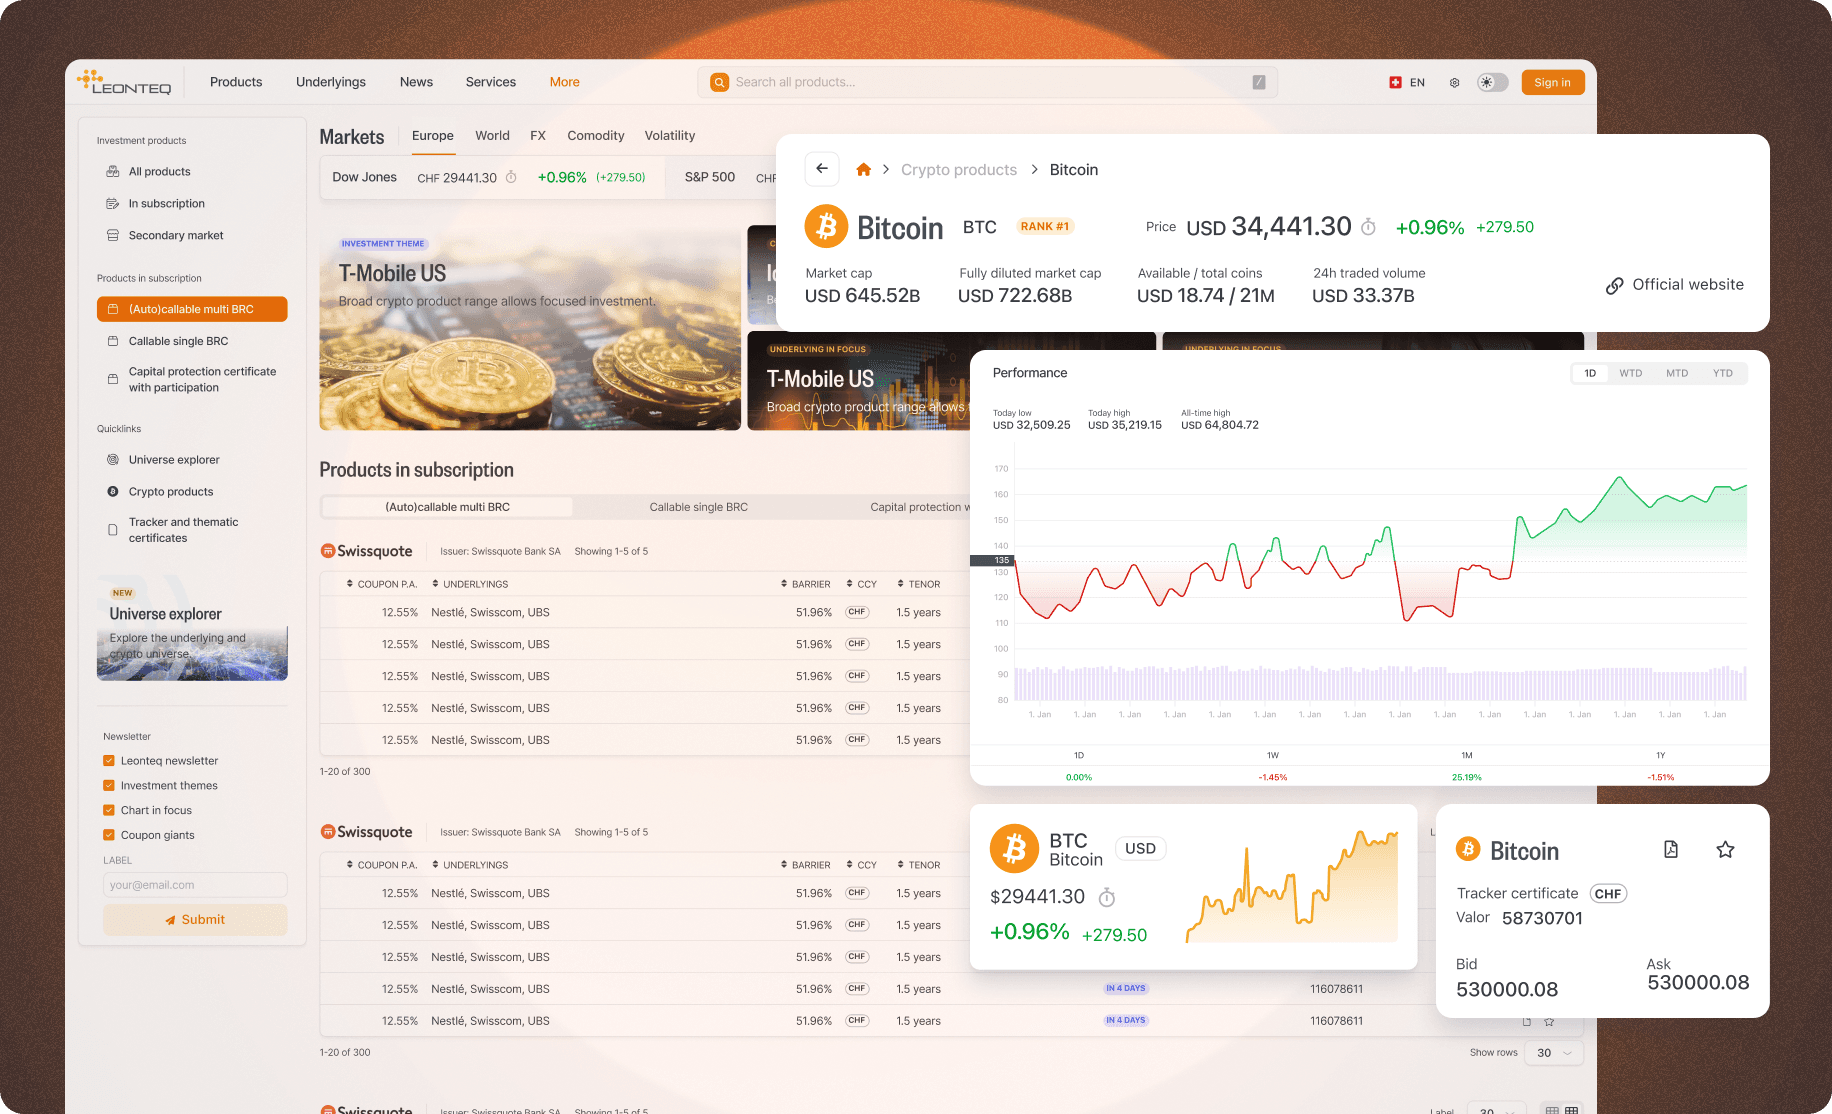
I designed the search experience and chart system that helped relationship managers explain complex crypto products to their clients.
My Role
Lead Product Designer
Team
2 designers, 6 engineers
Timeline
5 months
Platform
Web application
What I was responsible for
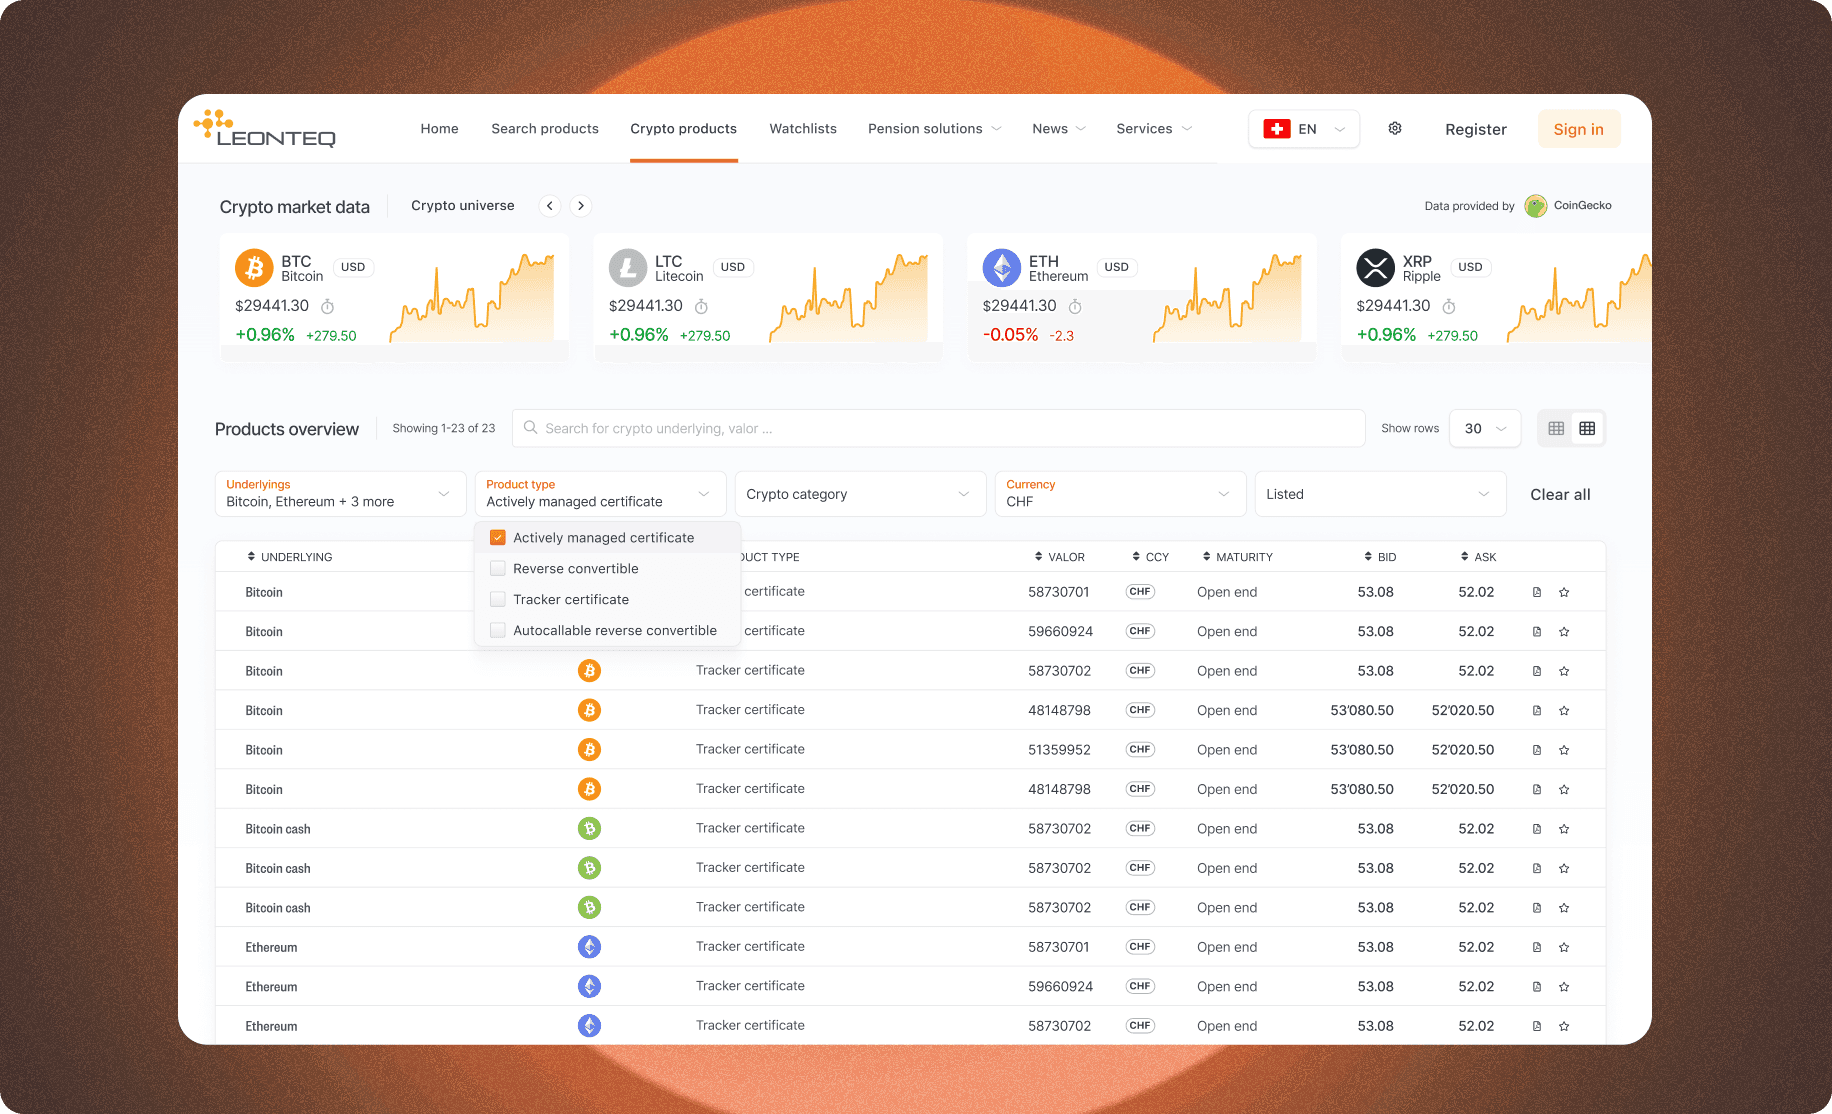
- I designed search, filtering and the product detail pages.
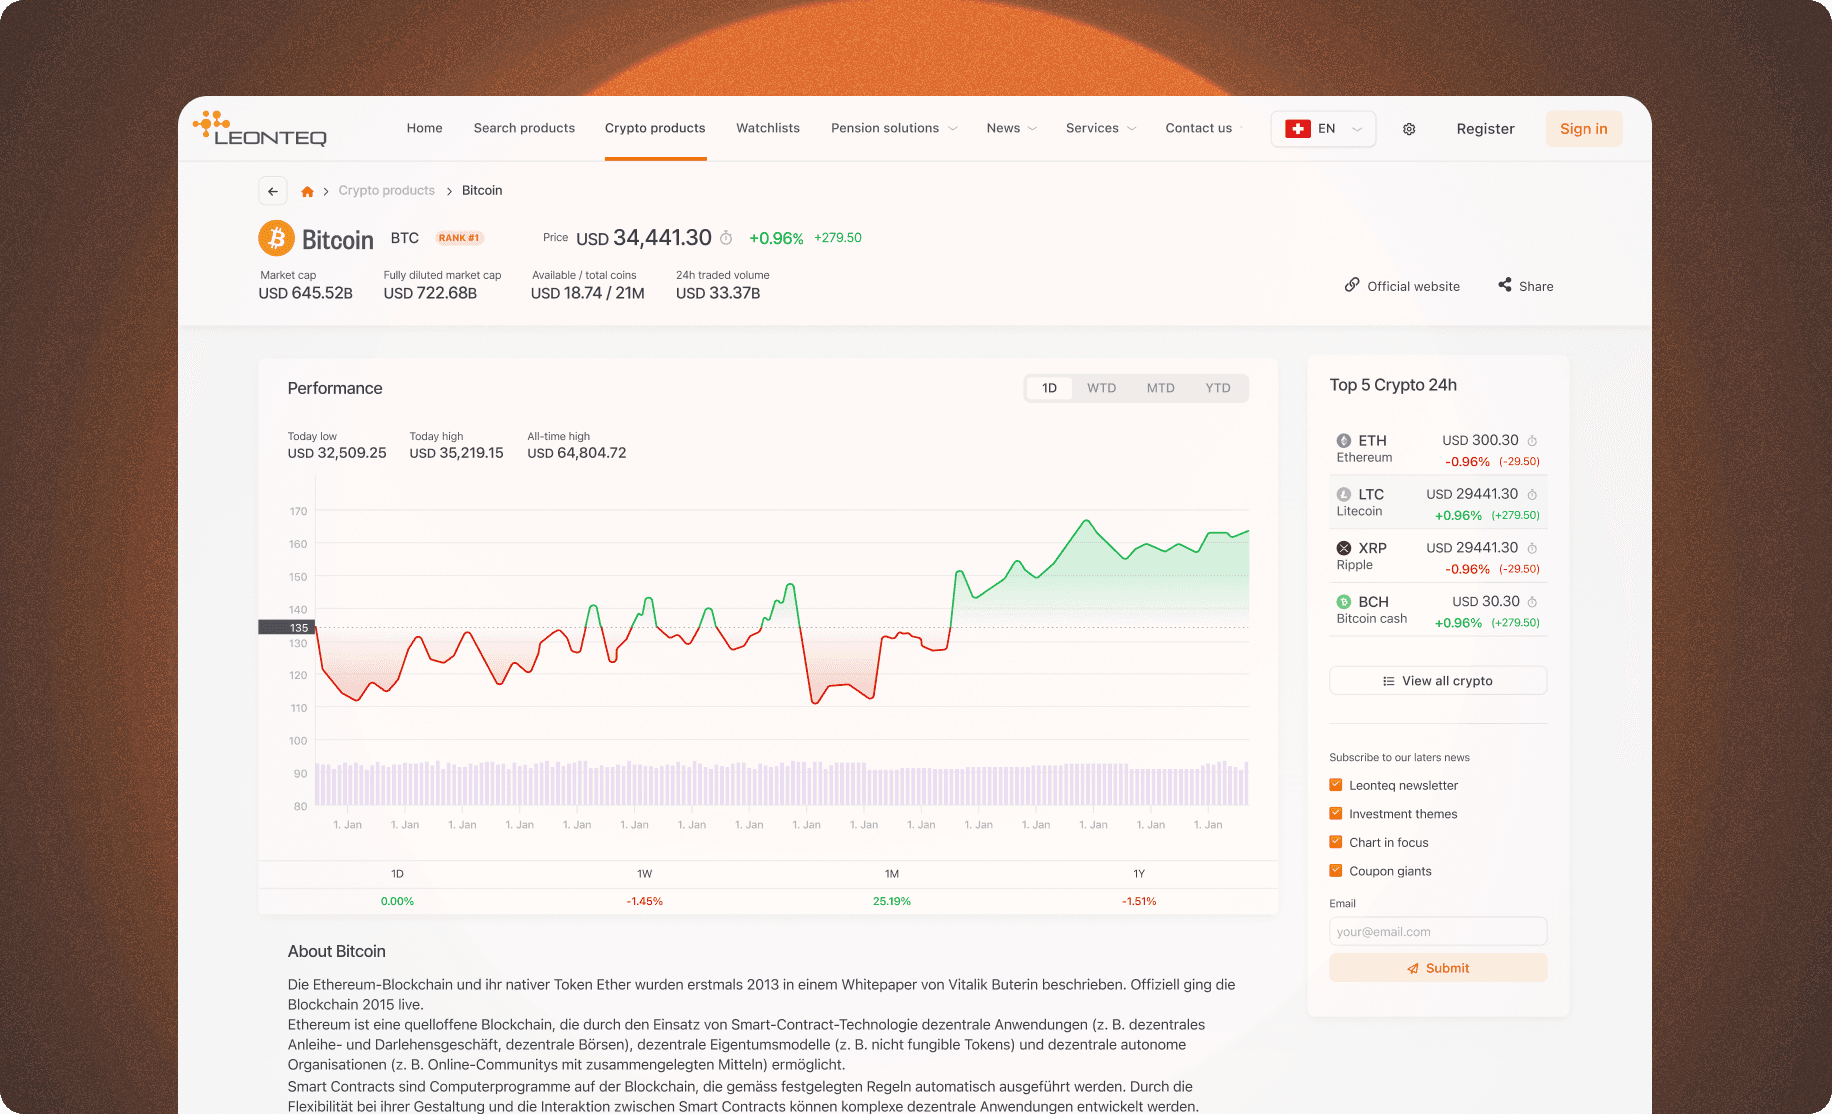
- I defined three levels of information: an overview, the chart and key terms, then the full term sheet.
- I designed the chart system and specified its structural levels and annotation logic with the front-end team.
What I needed to make clearer
The existing interface presented sophisticated products through dense tables of numbers. Strike prices, barriers and observation dates were visible, but the relationship between those terms and the underlying asset’s performance was difficult to read.
I focused on the people who had to explain that relationship: relationship managers and their institutional clients. I needed to make product discovery faster while keeping enough detail for an informed conversation.
◢Key Insight“I wanted the interface to help someone explain a product, not simply display its terms.”
◢ Process
- 01
I learned the decisions behind the data
I worked alongside traders, relationship managers and institutional clients to map discovery through to order placement.
- 02
I set the information hierarchy
I organised the experience into overview cards, charts with key terms, and the full term sheet.
- 03
I designed the chart system
I worked through how each product structure should appear, including strikes, barriers and observation dates.
- 04
I refined the prototype
The prototype was reviewed with six relationship managers and four institutional clients. I used that feedback to refine the amount of detail at each level.
- 05
We delivered in phases
The team released search and overview cards, followed by detail pages, then watchlist and comparison.
The decision I built the interface around
I made the performance chart the centre of the detail page. I wanted someone to see the underlying asset’s price history alongside the strike, barrier and observation levels that mattered for that product.
I designed a reusable chart system rather than a separate visual for each instrument. Working with the front-end team, I specified how the component should read product terms and display the appropriate levels, annotations and risk indicators.
I also defined a three-level information structure. The overview helped people find a product, the chart and key terms helped them understand it, and the full term sheet remained available for deeper review.
What changed
Reported project outcomes from the work we delivered.
- 40%
- faster product discovery, avg. search-to-selection time
- 60%
- reduction in support queries about product structure
- 3x
- increase in average product detail page engagement
- 89%
- of pilot users preferred the new interface in A/B test
What I took from this project
This project sharpened how I think about information design. A chart earns its place when it helps someone answer a question that a table makes difficult.
I also learned to design for changing conditions. The numbers could move quickly, but the hierarchy, labels and interaction needed to stay predictable. That is the kind of clarity I look for in any complex product.